


最新下载


热门教程
- 1
- 2
- 3
- 4
- 5
- 6
- 7
- 8
- 9
- 10
wxpython如何绘制音频效果 wxpython绘制音频效果代码实例
时间:2019-11-18 编辑:袖梨 来源:一聚教程网
本篇文章小编给大家分享一下wxpython绘制音频效果代码实例,小编觉得挺不错的,现在分享给大家供大家参考,有需要的小伙伴们可以来看看。
#-*- coding: utf-8 -*-
################################################################################
## 使用wxPython的绘图模块wxPyPlot,需要数据可视化的时候,无需再借用其他的库或模块了
################################################################################
import numpy as np
import wx
import wx.lib.plot as wxPyPlot # 导入绘图模块,并命名为wxPyPlot
import wave
import pylab as pl
# 需要把数据封装进入MyDataObject中
def MyDataObject():
# 50 个点的sin函数,用蓝色圆点表示
data1 = 2.*np.pi*np.arange(100)/100.
data1.shape = (50, 2)
data1[:, 1] = np.sin(data1[:, 0])
print ("debug:", data1.shape)
markers = wxPyPlot.PolyMarker(data1, legend='Green Markers', colour='blue', marker='circle', size=1)
# 50个点的cos函数,用红色表示
data2 = 2.*np.pi*np.arange(100)/100.
data2.shape = (50, 2)
print ("debug: data2", len(data2))
data2[:, 1] = np.cos(data2[:, 0])
lines = wxPyPlot.PolySpline(data2, legend='Red Line', colour='red')
GraphTitle = "Plot Data(Sin and Cos)"
return wxPyPlot.PlotGraphics([markers, lines], GraphTitle, "X Axis", "Y Axis")
# 解析wav数据
def MyWavData(wav_filename=""):
print('working')
# 打开wav文档
file = wave.open("mic4.wav", "r")
# 读取格式信息
# (nchannels, sampwidth,framerate, nframes, comptype, compname)
params = file.getparams()
nchannels, sampwidth, framerate, nframes = params[:4]
print (nchannels, sampwidth, framerate, nframes)
# 读取波形数据
str_data = file.readframes(nframes)
# 文件使用完毕,关闭文件
file.close()
# 将波形数据装换成数组
wave_data = np.fromstring(str_data, dtype=np.short)
wave_data.shape = (-1, 2)
wave_data = wave_data.T # 矩阵转置
time = np.arange(0, nframes) * (1.0 / framerate)
# print ("debug: time:", len(time))
# print ("debug: wave_data:", len(wave_data[0][0:len(time)]))
# print ("debug: time:", time)
# print ("debug: wave:", wave_data)
time_and_wav = np.asarray([time, wave_data[0][0:len(time)]]).T
print ("debug: len of time and wav: ", len(time_and_wav))
print ("debug: time and wav: ", time_and_wav.shape)
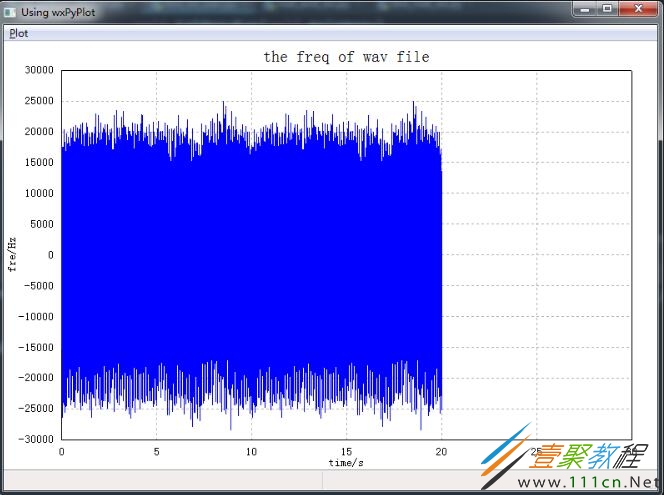
lines = wxPyPlot.PolySpline(time_and_wav, legend='Blue Line', colour='blue')
GraphTitle = "the freq of wav file"
return wxPyPlot.PlotGraphics([lines, ], GraphTitle, "time/s", "fre/Hz")
class TestFrame1(wx.Frame):
def __init__(self, parent=None, id=wx.ID_ANY, title="Using wxPyPlot"):
wx.Frame.__init__(self, parent, id, title, size=(800, 600))
# 创建菜单栏
self.mainmenu = wx.MenuBar()
# 创建菜单
menu = wx.Menu()
menu.Append(100, 'Draw1', 'Draw plots1')
self.Bind(wx.EVT_MENU, self.OnPlotDraw1, id=100)
menu.Append(200, 'Draw_wav', 'Draw wav')
self.Bind(wx.EVT_MENU, self.OnPlotDraw_wav, id=200)
# 添加菜单到菜单栏
self.mainmenu.Append(menu, '&Plot')
# 设置菜单Bar
self.SetMenuBar(self.mainmenu)
# 创建状态栏,显示信息
self.CreateStatusBar(2)
self.pc = wxPyPlot.PlotCanvas(self) # 此处导入绘图面板
def OnPlotDraw1(self, event): # 绘图函数
self.pc.Draw(MyDataObject())
def OnPlotDraw_wav(self, event):
self.pc.Draw(MyWavData())
def main():
app = wx.App()
# MyWavData()
tf = TestFrame1()
tf.Show()
app.MainLoop()
# 测试wxPyPlot的代码
if __name__ == '__main__':
main()
相关文章
- Golang ProtoBuf的基本语法详解 10-20
- Python识别MySQL中的冗余索引解析 10-20
- Python+Pygame绘制小球代码展示 10-18
- Python中的数据精度问题介绍 10-18
- Python随机值生成的常用方法介绍 10-18
- python3解压缩.gz文件分析 09-27