


最新下载


热门教程
- 1
- 2
- 3
- 4
- 5
- 6
- 7
- 8
- 9
- 10
python3如何实现绘制二维点图 python3实现绘制二维点图代码实例
时间:2019-12-04 编辑:袖梨 来源:一聚教程网
本篇文章小编给大家分享一下python3实现绘制二维点图代码实例,小编觉得挺不错的,现在分享给大家供大家参考,有需要的小伙伴们可以来看看。
如下所示:
import matplotlib.pyplot as plt
plt.plot([1,2,3],[4,5,6],'ro')
plt.show()#这个智障的编辑器,,,看来高版本的确修复了一些bug
用python3的qt5出来的图形,效果很好:
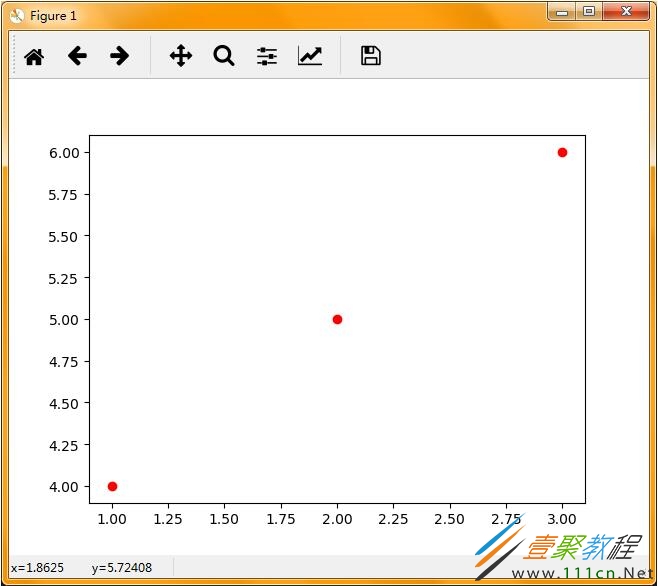
而且在上面的图像中也可以用调整按钮进行适当的调整。
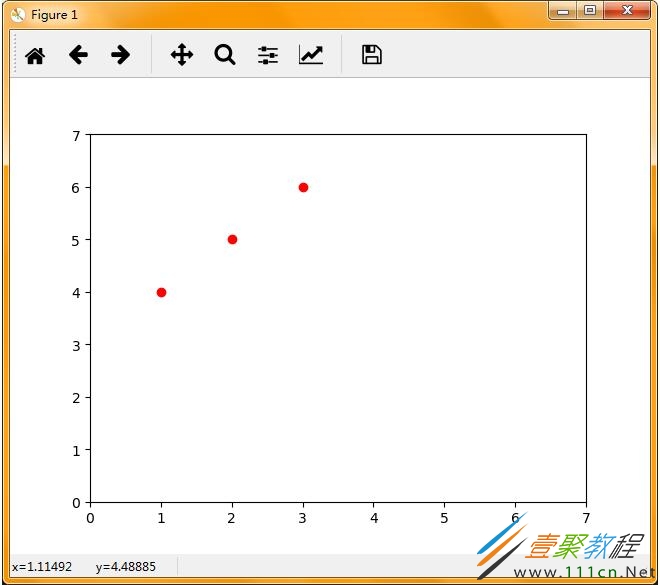
下面我们直接用代码进行坐标的调整:
import matplotlib.pyplot as plt
plt.xlim(xmax=7,xmin=0)
plt.ylim(ymax=7,ymin=0)
plt.plot([1,2,3],[4,5,6],'ro')
plt.show()
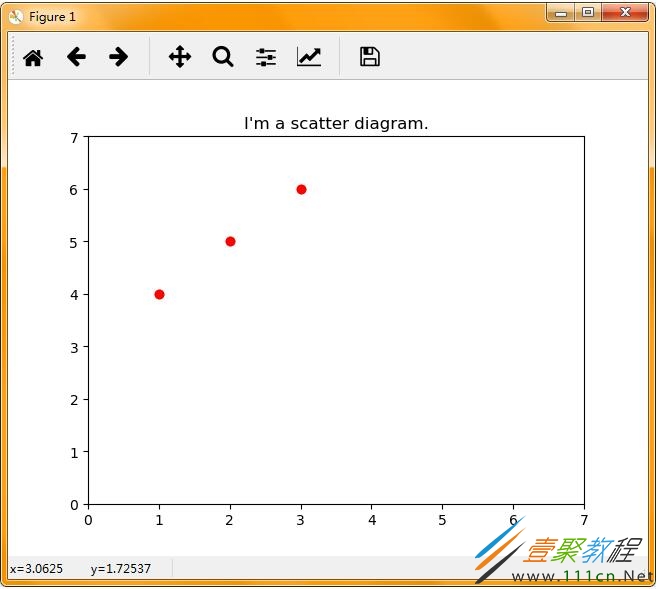
下面加一个标题,叫做散点图
import matplotlib.pyplot as plt
plt.title("I'm a scatter diagram.")
plt.xlim(xmax=7,xmin=0)
plt.ylim(ymax=7,ymin=0)
plt.plot([1,2,3],[4,5,6],'ro')
plt.show()
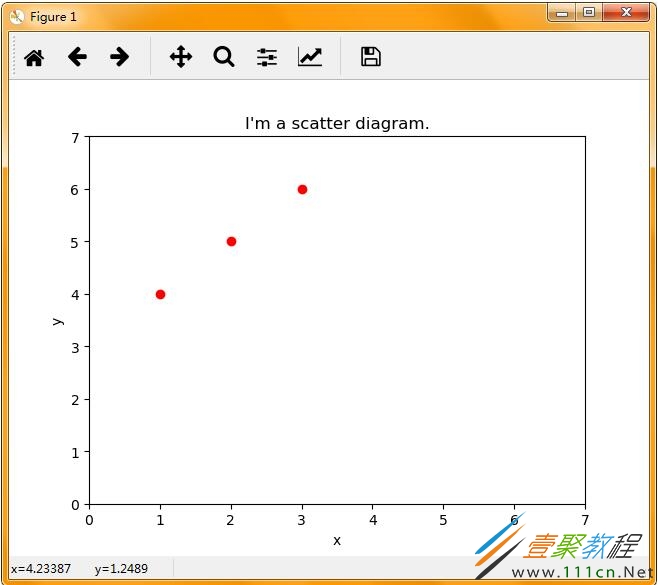
给xy轴进行命名
import matplotlib.pyplot as plt
plt.title("I'm a scatter diagram.")
plt.xlim(xmax=7,xmin=0)
plt.ylim(ymax=7,ymin=0)
plt.xlabel("x")
plt.ylabel("y")
plt.plot([1,2,3],[4,5,6],'ro')
plt.show()
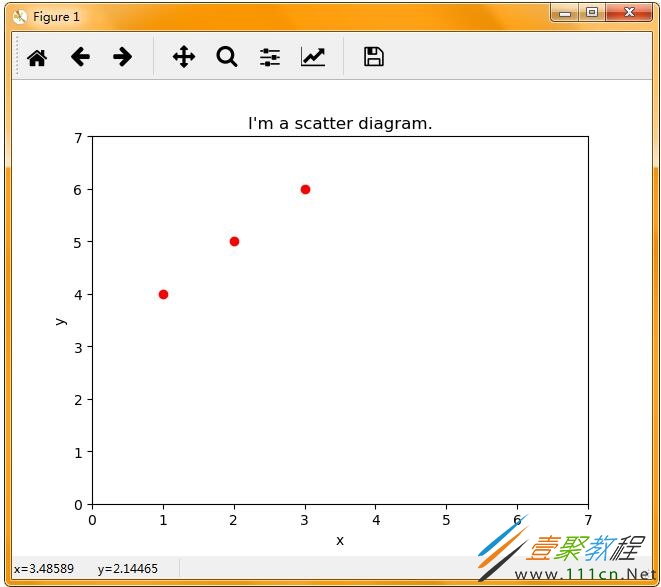
加一个标注:
import matplotlib.pyplot as plt
plt.title("I'm a scatter diagram.")
plt.xlim(xmax=7,xmin=0)
plt.ylim(ymax=7,ymin=0)
plt.annotate("(3,6)", xy = (3, 6), xytext = (4, 5), arrowprops = dict(facecolor = 'black', shrink = 0.1))
plt.xlabel("x")
plt.ylabel("y")
plt.plot([1,2,3],[4,5,6],'ro')
plt.show()
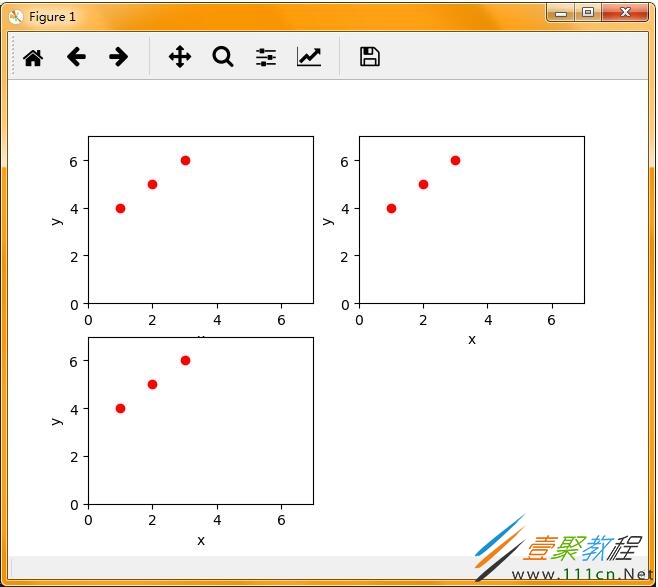
多画几个图:
import matplotlib.pyplot as plt

plt.subplot(221)
plt.xlim(xmax=7,xmin=0)
plt.ylim(ymax=7,ymin=0)
plt.xlabel("x")
plt.ylabel("y")
plt.plot([1,2,3],[4,5,6],'ro')

plt.subplot(222)
plt.xlim(xmax=7,xmin=0)
plt.ylim(ymax=7,ymin=0)
plt.xlabel("x")
plt.ylabel("y")
plt.plot([1,2,3],[4,5,6],'ro')


plt.subplot(223)
plt.xlim(xmax=7,xmin=0)
plt.ylim(ymax=7,ymin=0)
plt.xlabel("x")
plt.ylabel("y")
plt.plot([1,2,3],[4,5,6],'ro')

plt.show()
相关文章
- Golang ProtoBuf的基本语法详解 10-20
- Python识别MySQL中的冗余索引解析 10-20
- Python+Pygame绘制小球代码展示 10-18
- Python中的数据精度问题介绍 10-18
- Python随机值生成的常用方法介绍 10-18
- python3解压缩.gz文件分析 09-27