


最新下载


热门教程
- 1
- 2
- 3
- 4
- 5
- 6
- 7
- 8
- 9
- 10
python matplotlib绘制三维图代码示例
时间:2020-09-24 编辑:袖梨 来源:一聚教程网
本篇文章小编给大家分享一下python matplotlib绘制三维图代码示例,文章代码介绍的很详细,小编觉得挺不错的,现在分享给大家供大家参考,有需要的小伙伴们可以来看看。
新建一个matplotlib.figure.Figure对象,然后向其添加一个Axes3D类型的axes对象。
其中Axes3D对象的创建,类似其他axes对象,只不过使用projection='3d'关键词。
import matplotlib.pyplot as plt
from mpl_toolkits.mplot3d import Axes3D
fig = plt.figure()
ax = fig.add_subplot(111, projection='3d')
3D曲线图
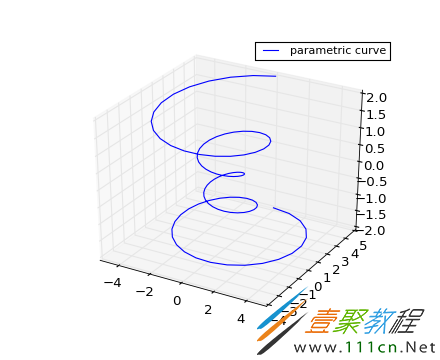
import matplotlib as mpl
from mpl_toolkits.mplot3d import Axes3D
import numpy as np
import matplotlib.pyplot as plt

mpl.rcParams['legend.fontsize'] = 10

fig = plt.figure()
ax = fig.gca(projection='3d')
theta = np.linspace(-4 * np.pi, 4 * np.pi, 100)
z = np.linspace(-2, 2, 100)
r = z**2 + 1
x = r * np.sin(theta)
y = r * np.cos(theta)
ax.plot(x, y, z, label='parametric curve')
ax.legend()
ax.set_xlabel('X Label')
ax.set_ylabel('Y Label')
ax.set_zlabel('Z Label')
plt.show()
简化用法:
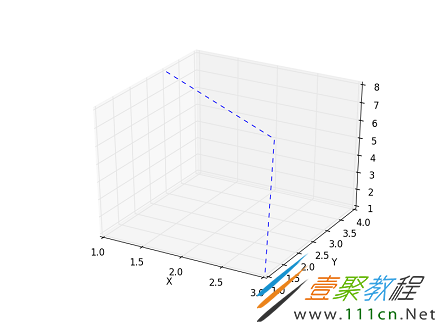
from pylab import *
from mpl_toolkits.mplot3d import Axes3D

plt.gca(projection='3d')
plt.plot([1,2,3],[3,4,1],[8,4,1],'--')
plt.xlabel('X')
plt.ylabel('Y')
#plt.zlabel('Z') #无法使用
3D散点图
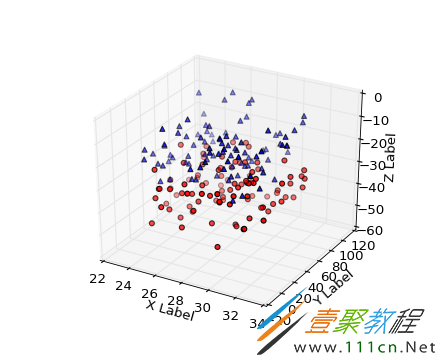
import numpy as np
from mpl_toolkits.mplot3d import Axes3D
import matplotlib.pyplot as plt

def randrange(n, vmin, vmax):
  return (vmax-vmin)*np.random.rand(n) + vmin

fig = plt.figure()
ax = fig.add_subplot(111, projection='3d')
n = 100
for c, m, zl, zh in [('r', 'o', -50, -25), ('b', '^', -30, -5)]:
  xs = randrange(n, 23, 32)
  ys = randrange(n, 0, 100)
  zs = randrange(n, zl, zh)
  ax.scatter(xs, ys, zs, c=c, marker=m)

ax.set_xlabel('X Label')
ax.set_ylabel('Y Label')
ax.set_zlabel('Z Label')

plt.show()
相关文章
- Golang ProtoBuf的基本语法详解 10-20
- Python识别MySQL中的冗余索引解析 10-20
- Python+Pygame绘制小球代码展示 10-18
- Python中的数据精度问题介绍 10-18
- Python随机值生成的常用方法介绍 10-18
- python3解压缩.gz文件分析 09-27