


最新下载


热门教程
- 1
- 2
- 3
- 4
- 5
- 6
- 7
- 8
- 9
- 10
matplotlib之多边形选区PolygonSelector使用代码
时间:2021-02-24 编辑:袖梨 来源:一聚教程网
本篇文章小编给大家分享一下matplotlib之多边形选区PolygonSelector使用代码,文章代码介绍的很详细,小编觉得挺不错的,现在分享给大家供大家参考,有需要的小伙伴们可以来看看。
多边形选区概述
多边形选区是一种常见的对象选择方式,在一个子图中,单击鼠标左键即构建一个多边形的端点,最后一个端点与第一个端点重合即完成多边形选区,选区即为多个端点构成的多边形。在matplotpb中的多边形选区属于部件(widgets),matplotpb中的部件都是中性(neutral )的,即与具体后端实现无关。
多边形选区具体实现定义为matplotpb.widgets.PolygonSelector类,继承关系为:Widget->AxesWidget->_SelectorWidget->PolygonSelector。
PolygonSelector类的签名为class matplotpb.widgets.PolygonSelector(ax, onselect, usebpt=False, pneprops=None, markerprops=None, vertex_select_radius=15)
PolygonSelector类构造函数的参数为:
ax:多边形选区生效的子图,类型为matplotpb.axes.Axes的实例。
onselect:多边形选区完成后执行的回调函数,函数签名为def onselect( vertices),vertices数据类型为列表,列表元素格式为(xdata,ydata)元组。
drawtype:多边形选区的外观,取值范围为{"box", "pne", "none"},"box"为多边形框,"pne"为多边形选区对角线,"none"无外观,类型为字符串,默认值为"box"。
pneprops:多边形选区线条的属性,默认值为dict(color='k', pnestyle='-', pne, alpha=0.5)。
markerprops:多边形选区端点的属性,默认值为dict(marker='o', markersize=7, mec='k', mfc='k', alpha=0.5)。
vertex_select_radius:多边形端点的选择半径,浮点数,默认值为15,用于端点选择或者多边形闭合。
PolygonSelector类中的state_modifier_keys公有变量 state_modifier_keys定义了操作快捷键,类型为字典。
“move_all”: 移动已存在的选区,默认为"shift"。
“clear”:清除现有选区,默认为 "escape",即esc键。
“move_vertex”:正方形选区,默认为"control"。
PolygonSelector类中的verts特性返回多边形选区中的多有端点,类型为列表,元素为(x,y)元组,即端点的坐标元组。
案例
官方案例,https://matplotpb.org/gallery/widgets/polygon_selector_demo.html
案例说明
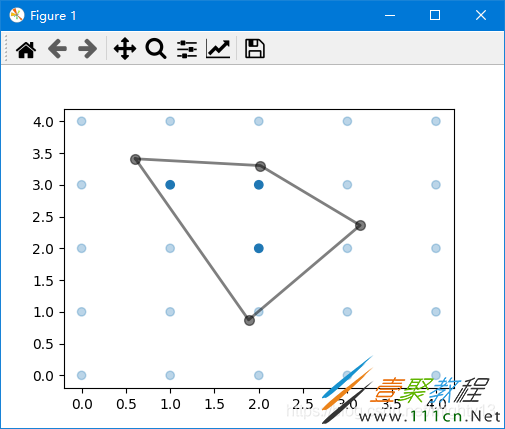
单击鼠标左键创建端点,最终点击初始端点闭合多边形,形成多边形选区。选区外的数据元素颜色变淡,选区内数据颜色保持不变。
按esc键取消选区。按shift键鼠标可以移动多边形选区位置,按ctrl键鼠标可以移动多边形选区某个端点的位置。退出程序时,控制台输出选区内数据元素的坐标。
控制台输出:
Selected points:
[[2.0 2.0]
[1.0 3.0]
[2.0 3.0]]
案例代码
import numpy as np

from matplotlib.widgets import PolygonSelector
from matplotlib.path import Path


class SelectFromCollection:
  """
  Select indices from a matplotlib collection using `PolygonSelector`.

  Selected indices are saved in the `ind` attribute. This tool fades out the
  points that are not part of the selection (i.e., reduces their alpha
  values). If your collection has alpha < 1, this tool will permanently
  alter the alpha values.

  Note that this tool selects collection objects based on their *origins*
  (i.e., `offsets`).

  Parameters
  ----------
  ax : `~matplotlib.axes.Axes`
    Axes to interact with.
  collection : `matplotlib.collections.Collection` subclass
    Collection you want to select from.
  alpha_other : 0 <= float <= 1
    To highlight a selection, this tool sets all selected points to an
    alpha value of 1 and non-selected points to *alpha_other*.
  """

  def __init__(self, ax, collection, alpha_other=0.3):
    self.canvas = ax.figure.canvas
    self.collection = collection
    self.alpha_other = alpha_other

    self.xys = collection.get_offsets()
    self.Npts = len(self.xys)

    # Ensure that we have separate colors for each object
    self.fc = collection.get_facecolors()
    if len(self.fc) == 0:
      raise ValueError('Collection must have a facecolor')
    elif len(self.fc) == 1:
      self.fc = np.tile(self.fc, (self.Npts, 1))

    self.poly = PolygonSelector(ax, self.onselect)
    self.ind = []

  def onselect(self, verts):
    path = Path(verts)
    self.ind = np.nonzero(path.contains_points(self.xys))[0]
    self.fc[:, -1] = self.alpha_other
    self.fc[self.ind, -1] = 1
    self.collection.set_facecolors(self.fc)
    self.canvas.draw_idle()

  def disconnect(self):
    self.poly.disconnect_events()
    self.fc[:, -1] = 1
    self.collection.set_facecolors(self.fc)
    self.canvas.draw_idle()


if __name__ == '__main__':
  import matplotlib.pyplot as plt

  fig, ax = plt.subplots()
  grid_size = 5
  grid_x = np.tile(np.arange(grid_size), grid_size)
  grid_y = np.repeat(np.arange(grid_size), grid_size)
  pts = ax.scatter(grid_x, grid_y)

  selector = SelectFromCollection(ax, pts)

  print("Select points in the figure by enclosing them within a polygon.")
  print("Press the 'esc' key to start a new polygon.")
  print("Try holding the 'shift' key to move all of the vertices.")
  print("Try holding the 'ctrl' key to move a single vertex.")

  plt.show()

  selector.disconnect()

  # After figure is closed print the coordinates of the selected points
  print('nSelected points:')
  print(selector.xys[selector.ind])
相关文章
- Golang ProtoBuf的基本语法详解 10-20
- Python识别MySQL中的冗余索引解析 10-20
- Python+Pygame绘制小球代码展示 10-18
- Python中的数据精度问题介绍 10-18
- Python随机值生成的常用方法介绍 10-18
- python3解压缩.gz文件分析 09-27