


最新下载


热门教程
- 1
- 2
- 3
- 4
- 5
- 6
- 7
- 8
- 9
- 10
matplotlib bar()实现百分比堆积柱状图代码示例
时间:2021-02-24 编辑:袖梨 来源:一聚教程网
本篇文章小编给大家分享一下matplotlib bar()实现百分比堆积柱状图代码示例,文章代码介绍的很详细,小编觉得挺不错的,现在分享给大家供大家参考,有需要的小伙伴们可以来看看。
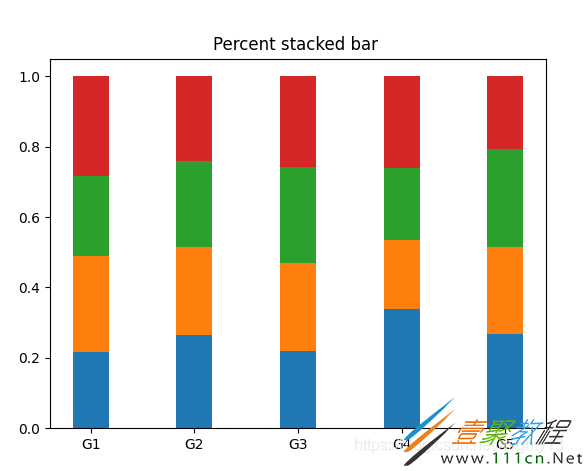
使用matplotlib创建百分比堆积柱状图的思路与堆积柱状图类似,只不过bottom参数累计的不是数值而是百分比,因此,需要事先计算每组柱子的数值总和,进而求百分比。
未使用numpy版本
适用于少量数据,数据结构需要手动构造。
import matplotlib.pyplot as plt

labels = ['G1', 'G2', 'G3', 'G4', 'G5']
first = [20, 34, 30, 35, 27]
second = [25, 32, 34, 20, 25]
third = [21, 31, 37, 21, 28]
fourth = [26, 31, 35, 27, 21]
data = [first, second, third, fourth]

x = range(len(labels))
.35

# 将bottom_y元素都初始化为0
bottom_y = [0] * len(labels)
# 计算每组柱子的总和,为计算百分比做准备
sums = [sum(i) for i in zip(first, second, third, fourth)]
for i in data:
 # 计算每个柱子的高度,即百分比
 y = [a/b for a, b in zip(i, sums)]
 plt.bar(x, y, width, bottom=bottom_y)
 # 计算bottom参数的位置
 bottom_y = [(a+b) for a, b in zip(y, bottom_y)]

plt.xticks(x, labels)
plt.title('Percent stacked bar ')
plt.show()
使用numpy版本
第一个版本的缺陷在于数据需要手动构造,而且计算稍微繁琐一些。
使用numpy便于处理规模比较大且已存储在文件中数据的数据,计算更简便。
import numpy as np
import matplotlib.pyplot as plt

labels = ['G1', 'G2', 'G3', 'G4', 'G5']
first = [20, 34, 30, 35, 27]
second = [25, 32, 34, 20, 25]
third = [21, 31, 37, 21, 28]
fourth = [26, 31, 35, 27, 21]
data = [first, second, third, fourth]

x = range(len(labels))
.35

# 将bottom_y元素都初始化为0
bottom_y = np.zeros(len(labels))
data = np.array(data)
# 按列计算计算每组柱子的总和,为计算百分比做准备
sums = np.sum(data, axis=0)
for i in data:
 # 计算每个柱子的高度,即百分比
 y = i / sums
 plt.bar(x, y, width, bottom=bottom_y)
 # 计算bottom参数的位置
 bottom_y = y + bottom_y

plt.xticks(x, labels)
plt.title('Percent stacked bar ')
plt.show()
相关文章
- Golang ProtoBuf的基本语法详解 10-20
- Python识别MySQL中的冗余索引解析 10-20
- Python+Pygame绘制小球代码展示 10-18
- Python中的数据精度问题介绍 10-18
- Python随机值生成的常用方法介绍 10-18
- python3解压缩.gz文件分析 09-27