


最新下载


热门教程
- 1
- 2
- 3
- 4
- 5
- 6
- 7
- 8
- 9
- 10
Python实现爬取天气数据并可视化代码解析
时间:2022-02-22 编辑:袖梨 来源:一聚教程网
本篇文章小编给大家分享一下Python实现爬取天气数据并可视化代码解析,文章代码介绍的很详细,小编觉得挺不错的,现在分享给大家供大家参考,有需要的小伙伴们可以来看看。
核心功能设计
总体来说,我们需要先对中国天气网中的天气数据进行爬取,保存为csv文件,并将这些数据进行可视化分析展示。
拆解需求,大致可以整理出我们需要分为以下几步完成:
1.通过爬虫获取中国天气网7.20-7.21的降雨数据,包括城市,风力方向,风级,降水量,相对湿度,空气质量。
2.对获取的天气数据进行预处理,分析河南的风力等级和风向,绘制风向风级雷达图。
3.根据获取的温度和湿度绘制温湿度相关性分析图,进行温度、湿度对比分析。
4.根据获取的各城市的降雨量,可视化近24小时的每小时时段降水情况。
5.绘制各城市24小时的累计降雨量。
实现步骤
爬取数据
首先我们需要获取各个城市的降雨数据,通过对中国天气网网址分析发现,城市的天气网址为:http://www.weather.com.cn/weather/101180101.shtml。

根据对数据分析,返回的json格式数据,不难发现:
101180101就是代表城市编号- 7天的天气预报数据信息在div标签中并且id=“7d”- 日期、天气、温度、风级等信息都在ul和li标签 网页结构我们上面已经分析好了,那么我们就可以来动手爬取所需要的数据了。获取到所有的数据资源之后,可以把这些数据保存下来。
请求网站
天气网的网址:http://www.weather.com.cn/weather/101180101.shtml。如果想爬取不同的地区只需修改最后的101180101地区编号,前面的weather代表是7天的网页。
def getHTMLtext(url):
 """请求获得网页内容"""
 try:
  r = requests.get(url, timeout = 30)
  r.raise_for_status()
  r.encoding = r.apparent_encoding
  print("Success")
  return r.text
 except:
  print("Fail")
  return" "

处理数据
采用BeautifulSoup库对刚刚获取的字符串进行数据提取。获取我们需要的风力方向,风级,降水量,相对湿度,空气质量等。
def get_content(html,cityname):
 """处理得到有用信息保存数据文件"""
 final = []          # 初始化一个列表保存数据
 bs = BeautifulSoup(html, "html.parser")  # 创建BeautifulSoup对象
 body = bs.body
 data = body.find('div', {'id': '7d'})    # 找到div标签且id = 7d
 # 下面爬取当天的数据
 data2 = body.find_all('div',{'class':'left-div'})
 text = data2[2].find('script').string
 text = text[text.index('=')+1 :-2]   # 移除改var data=将其变为json数据
 jd = json.loads(text)
 dayone = jd['od']['od2']     # 找到当天的数据
 final_day = []           # 存放当天的数据
 count = 0
 for i in dayone:
  temp = []
  if count <=23:
   temp.append(i['od21'])     # 添加时间
   temp.append(cityname+'市')   # 添加城市
   temp.append(i['od22'])     # 添加当前时刻温度
   temp.append(i['od24'])     # 添加当前时刻风力方向
   temp.append(i['od25'])     # 添加当前时刻风级
   temp.append(i['od26'])     # 添加当前时刻降水量
   temp.append(i['od27'])     # 添加当前时刻相对湿度
   temp.append(i['od28'])     # 添加当前时刻控制质量
#    print(temp)
   final_day.append(temp)
   data_all.append(temp)
  count = count +1
 # 下面爬取24h的数据
 ul = data.find('ul')                     # 找到所有的ul标签
 li = ul.find_all('li')                   # 找到左右的li标签
 i = 0                                    # 控制爬取的天数
 for day in li:                          # 遍历找到的每一个li
     if i < 7 and i > 0:
         temp = []                        # 临时存放每天的数据
         date = day.find('h1').string     # 得到日期
         date = date[0:date.index('日')]  # 取出日期号
         temp.append(date)
         inf = day.find_all('p')          # 找出li下面的p标签,提取第一个p标签的值,即天气
         temp.append(inf[0].string)

         tem_low = inf[1].find('i').string   # 找到最低气温

         if inf[1].find('span') is None:   # 天气预报可能没有最高气温
             tem_high = None
         else:
             tem_high = inf[1].find('span').string  # 找到最高气温
         temp.append(tem_low[:-1])
         if tem_high[-1] == '℃':
          temp.append(tem_high[:-1])
         else:
          temp.append(tem_high)

         wind = inf[2].find_all('span')  # 找到风向
         for j in wind:
          temp.append(j['title'])

         wind_scale = inf[2].find('i').string # 找到风级
         index1 = wind_scale.index('级')
         temp.append(int(wind_scale[index1-1:index1]))
         final.append(temp)
     i = i + 1
 return final_day,final
城市的天气数据拿到了,同理我们可以根据不同的地区编号获取河南省各个地级市的天气数据。
Citycode = { "郑州": "101180101",
             "新乡": "101180301",
             "许昌": "101180401",
             "平顶山": "101180501",
             "信阳": "101180601",
             "南阳": "101180701",
             "开封": "101180801",
             "洛阳": "101180901",
             "商丘": "101181001",
             "焦作": "101181101",
             "鹤壁": "101181201",
             "濮阳": "101181301",
             "周口": "101181401",
             "漯河": "101181501",
             "驻马店": "101181601",
             "三门峡": "101181701",
             "济源": "101181801",
             "安阳": "101180201"}
citycode_lists = list(Citycode.items())
for city_code in citycode_lists:
    city_code = list(city_code)
    print(city_code)
    citycode = city_code[1]
    cityname = city_code[0]
    url1 = 'http://www.weather.com.cn/weather/'+citycode+ '.shtml'    # 24h天气中国天气网
 html1 = getHTMLtext(url1)
 data1, data1_7 = get_content(html1,cityname)  # 获得1-7天和当天的数据
存储数据
def write_to_csv(file_name, data, day=14):
 """保存为csv文件"""
 with open(file_name, 'a', errors='ignore', newline='') as f:
  if day == 14:
   header = ['日期','城市','天气','最低气温','最高气温','风向1','风向2','风级']
  else:
   header = ['小时','城市','温度','风力方向','风级','降水量','相对湿度','空气质量']
  f_csv = csv.writer(f)
  f_csv.writerow(header)
  f_csv.writerows(data)
write_to_csv('河南天气.csv',data_all,1)
这样我们就可以把全省的各个地级市天气数据保存下来了。

风向风级雷达图
统计全省的风力和风向,因为风力风向使用极坐标的方式展现比较清晰,所以我们采用极坐标的方式展现一天的风力风向图,将圆分为8份,每一份代表一个风向,半径代表平均风力,并且随着风级增高,蓝色加深。
def wind_radar(data):
 """风向雷达图"""
 wind = list(data['风力方向'])
 wind_speed = list(data['风级'])
 for i in range(0,24):
  if wind[i] == "北风":
   wind[i] = 90
  elif wind[i] == "南风":
   wind[i] = 270
  elif wind[i] == "西风":
   wind[i] = 180
  elif wind[i] == "东风":
   wind[i] = 360
  elif wind[i] == "东北风":
   wind[i] = 45
  elif wind[i] == "西北风":
   wind[i] = 135
  elif wind[i] == "西南风":
   wind[i] = 225
  elif wind[i] == "东南风":
   wind[i] = 315
 degs = np.arange(45,361,45)
 temp = []
 for deg in degs:
  speed = []
  # 获取 wind_deg 在指定范围的风速平均值数据
  for i in range(0,24):
   if wind[i] == deg:
    speed.append(wind_speed[i])
  if len(speed) == 0:
   temp.append(0)
  else:
   temp.append(sum(speed)/len(speed))
 print(temp)
 N = 8
 theta = np.arange(0.+np.pi/8,2*np.pi+np.pi/8,2*np.pi/8)
 # 数据极径
 radii = np.array(temp)
 # 绘制极区图坐标系
 plt.axes(polar=True)
 # 定义每个扇区的RGB值(R,G,B),x越大,对应的颜色越接近蓝色
 colors = [(1-x/max(temp), 1-x/max(temp),0.6) for x in radii]
 plt.bar(theta,radii,width=(2*np.pi/N),bottom=0.0,color=colors)
 plt.title('河南风级图--Dragon少年',x=0.2,fontsize=16)
 plt.show()
结果如下:

观察可以发现,当天的东北风最多,平均风级达到了1.75级。
温湿度相关性分析
我们可以分析温度和湿度之间是否存在关系,为了更加清楚直观地验证,可以使用离散点plt.scatter()方法将温度为横坐标、湿度为纵坐标,每个时刻的点在图中点出来,并且计算相关系数。
def calc_corr(a, b):
 """计算相关系数"""
 a_avg = sum(a)/len(a)
 b_avg = sum(b)/len(b)
 cov_ab = sum([(x - a_avg)*(y - b_avg) for x,y in zip(a, b)])
 sq = math.sqrt(sum([(x - a_avg)**2 for x in a])*sum([(x - b_avg)**2 for x in b]))
 corr_factor = cov_ab/sq
 return corr_factor


def corr_tem_hum(data):
 """温湿度相关性分析"""
 tem = data['温度']
 hum = data['相对湿度']
 plt.scatter(tem,hum,color='blue')
 plt.title("温湿度相关性分析图--Dragon少年")
 plt.xlabel("温度/℃")
 plt.ylabel("相对湿度/%")
 # plt.text(20,40,"相关系数为:"+str(calc_corr(tem,hum)),fontdict={'size':'10','color':'red'})
 plt.show()
 print("相关系数为:"+str(calc_corr(tem,hum)))
结果如下:
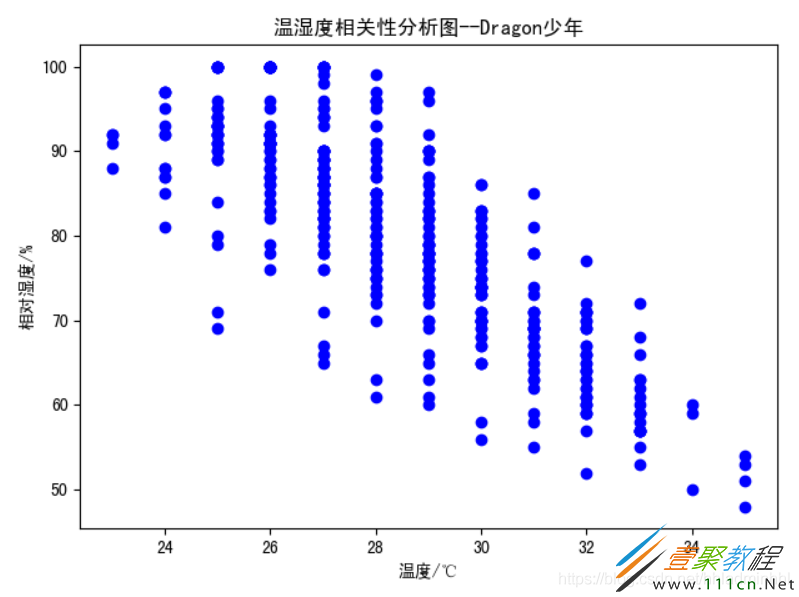
观察可以发现,一天的温度和湿度具有强烈的相关性,呈负相关。当温度较低时,空气中水分含量较多,湿度自然较高,而温度高时空气中可容纳的水汽增大,相对湿度随之降低,但其实空气中的水汽往往是增加的。
24小时内每小时时段降水
from pyecharts import options as opts
from pyecharts.charts import Map,Timeline
#定义一个timeline和map的组合图
def timeline_map(data):
    tl = Timeline().add_schema(play_interval =300,,is_rewind_play=False,orient = "horizontal",is_loop_play = True,is_auto_play=False)#设置播放速度、是否循环播放等参数
    for h in time_line_final:
        x =data[data["小时"]==h]['城市'].values.tolist() #选取指定城市
        y=data[data["小时"]==h]['降水量'].values.tolist() #选取时间的降水量
        map_shape = (
            Map()
            .add("{}h时降水量(mm)".format(h),[list(z) for z in zip(x, y)],"河南") #打包输入地区及对应降水量数据
            .set_series_opts(label_opts=opts.LabelOpts("{b}")) #配置系列参数,{b}为显示地区数据
            .set_global_opts(
                title_opts=opts.TitleOpts(title="河南省降雨分布--Dragon少年"), #全局参数中设置标题
                visualmap_opts=opts.VisualMapOpts(max_=300,  #设置映射配置项的最大值
                                                  is_piecewise=True, #设置是否为分段显示
                                                  pos_top = "60%", #映射配置项距图片上部的距离
                                                  pieces=[
                                                        {"min": 101, "label": '>100ml', "color": "#FF0000"},  # 分段指定颜色及名称
                                                        {"min": 11, "max": 50, "label": '11-50ml', "color": "#FF3333"},
                                                        {"min": 6, "max": 10, "label": '6-10ml', "color": "#FF9999"},
                                                        {"min": 0.1, "max": 5, "label": '0.1-5ml', "color": "#FFCCCC"}])
        ))
        tl.add(map_shape, "{}h".format(h)) #将不同日期的数据加入到timeline中
    return tl
timeline_map(data).render("rainfall.html")
24小时累计降雨量
from pyecharts import options as opts
from pyecharts.charts import Map,Timeline
#定义一个timeline和map的组合图
time_line_final = list(data1['小时'].iloc[0:24])
def timeline_map(data1):
    tl = Timeline().add_schema(play_interval =200,,is_rewind_play=False,orient = "horizontal",is_loop_play = True,is_auto_play=True)#设置播放速度、是否循环播放等参数
    for h in time_line_final:
        x =data1[data1["小时"]==h]['城市'].values.tolist() #选取指定城市
        y=data1[data1["小时"]==h]['降水量'].values.tolist() #选取时间的降水量
        map_shape1 = (
            Map()
            .add("{}h时累计降水量(mm)".format(h),[list(z) for z in zip(x, y)],"河南") #打包输入地区及对应降水量数据
            .set_series_opts(label_opts=opts.LabelOpts("{b}")) #配置系列参数,{b}为显示地区数据
            .set_global_opts(
                title_opts=opts.TitleOpts(title="河南省累计降雨分布--Dragon少年"), #全局参数中设置标题
                visualmap_opts=opts.VisualMapOpts(max_=300,  #设置映射配置项的最大值
                                                  is_piecewise=True, #设置是否为分段显示
                                                  pos_top = "60%", #映射配置项距图片上部的距离
                                                  pieces=[
                                                        {"min": 251, "label": '特大暴雨', "color": "#800000"},  # 分段指定颜色及名称
                                                        {"min": 101, "max": 250, "label": '暴雨', "color": "#FF4500"},
                                                        {"min": 51, "max": 100, "label": '暴雨', "color": "#FF7F50"},
                                                        {"min": 25, "max": 50, "label": '大雨', "color": "#FFFF00"},
                                                        {"min": 10, "max": 25, "label": '中雨', "color": "#1E90FF"},
                                                        {"min": 0.1, "max": 9.9, "label": '小雨', "color": "#87CEFA"}])
        ))
        tl.add(map_shape1, "{}h".format(h)) #将不同日期的数据加入到timeline中
    return tl
timeline_map(data1).render("rainfalltoall_1.html")
至此,天气数据分析可视化就完成啦
相关文章
- Golang ProtoBuf的基本语法详解 10-20
- Python识别MySQL中的冗余索引解析 10-20
- Python+Pygame绘制小球代码展示 10-18
- Python中的数据精度问题介绍 10-18
- Python随机值生成的常用方法介绍 10-18
- python3解压缩.gz文件分析 09-27